Profiling
You can profile a Wishbone server in order to locate performance issues by
starting the wishbone executable using the --profile option.
$ wishbone start --config test.yaml --profile
Pressing CTRL+C will stop the server and dump the profile file named
wishbone_<pid>_.cpuprofile in the current working directory.
The profile file can be loaded directly into Chrome’s “Developer Tools” for further analysis:
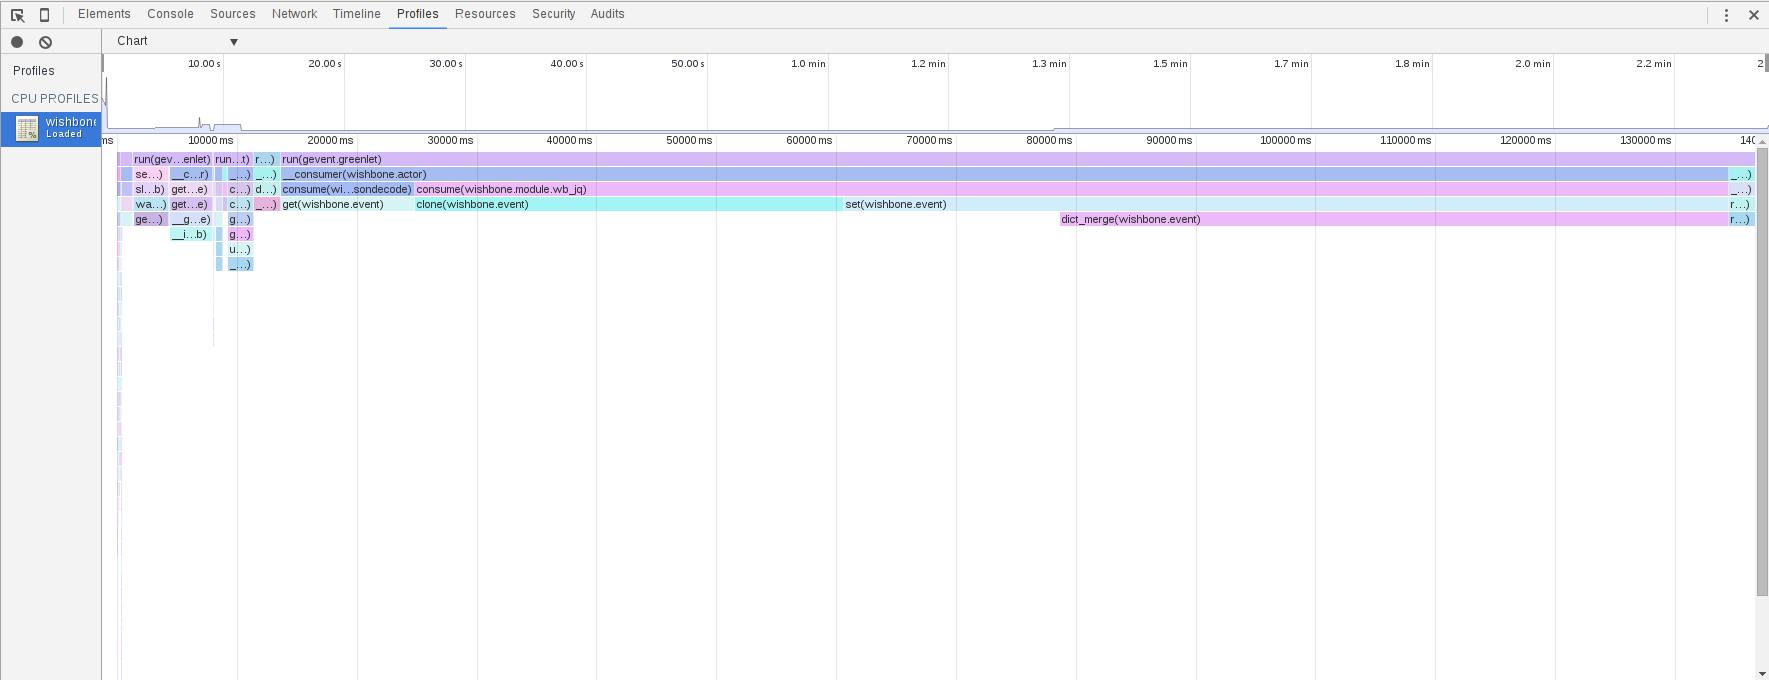
The javascript profiler is somewhat hidden in chrome. To open:
Options -> More Tools -> Developer Tools
Once developer tools is open select:
Options -> More Tools -> JavaScript profiler